Page 94 - PDYOT PROVINCIAL EL ORO PDF-1
P. 94

PLAN DE DESARROLLO Y ORDENAMIENTO TERRITORIAL DE LA PROVINCIA  DE EL ORO
                                                                                                                                                 PLAN DE DESARROLLO Y ORDENAMIENTO TERRITORIAL DE LA PROVINCIA  DE EL ORO


                  VAB                  2010              2011              2012              2013             2014            2015              2016              2017              2018              2019

            Sector Primario            $ 565.894          $752.524         $ 800.537         $887.473      $1.018.227          $562.118          $859.062        $1.043.585       $1.076.334        $1.146.816


                   %                         %27               %30               %28               %29             %31              %27               %27               %30               $30               %31


           Sector Industrial           $   69.641         $100.937         $ 104.466         $140.901        $160.634           $81.944          $158.274          $146.408         $177.808          $212.467

                   %                           %3                %4               %4                %5              %5                %4                %5               %4                 $5               %6

           Sector Servicios          $  1.489.467       $1.657.345       $ 1.952.234       $2.007.723      $2.152.414        $1.452.068        $2.156.457        $2.277.443       $2.316.710        $2.305.145

                   %                         %70               %66               %68               %66             %65              %69               %68               %66               $65               %63


                  Total                2.125.002         2.510.806         2.857.237         3.036.097      3.331.275         2.096.130         3.173.793         3.467.436         3.570.852         3.664.429


        62.    Tabla:  Valor agregado bruto.
        Fuente: Cuentas Nacionales- Banco Central del Ecuador.


                                          $2.500.000
                                     INVERSIÓN  $1.500.000
                                          $2.000.000


                                          $1.000.000

                                            $500.000
                                                     $0
                                                                2010           2011           2012          2013           2014           2015           2016           2017          2018           2019

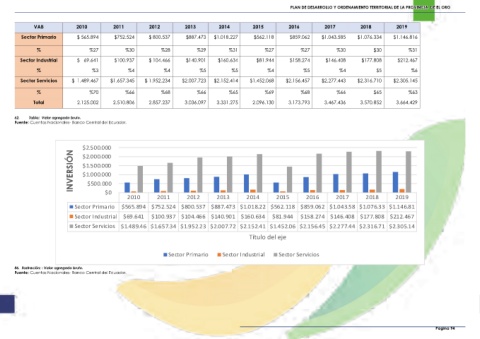
                                      Sector Primario        $565.894 $752.524 $800.537 $887.473 $1.018.22 $562.118 $859.062 $1.043.58 $1.076.33 $1.146.81

                                      Sector Industrial       $69.641       $100.937 $104.466 $140.901 $160.634                         $81.944       $158.274 $146.408 $177.808 $212.467

                                      Sector Servicios $1.489.46 $1.657.34 $1.952.23 $2.007.72 $2.152.41 $1.452.06 $2.156.45 $2.277.44 $2.316.71 $2.305.14

                                                                                                                             Título del eje


                                                                                     Sector Primario           Sector Industrial           Sector Servicios


        86.  Ilustración: : Valor agregado bruto.
        Fuente: Cuentas Nacionales- Banco Central del Ecuador.


                                                                                                                                                                                                                         Pagina 94
   89   90   91   92   93   94   95   96   97   98   99